When National Weather Service meteorologists hit the pavement after a storm, they aren't just looking at broken roofs. They're solving a complex forensic puzzle to determine if a tornado touched down, how fast the winds were blowing, and exactly where the damage ended. It's a meticulous process that relies on specific tools like the Damage Assessment Toolkit, not just visual inspection.
Here's the thing: you can't tell a tornado from straight-line wind damage just by standing back and staring at a flattened neighborhood. The pattern matters more than the volume of destruction. And getting it right? That determines insurance payouts, building code updates, and our understanding of severe weather trends across the country.
The Forensic Science of Wind Damage
It starts with what looks like chaos but is actually data. Survey teams deploy immediately after significant storms to identify the worst damage. But "worst" doesn't always mean "most dramatic." It means "most diagnostic."
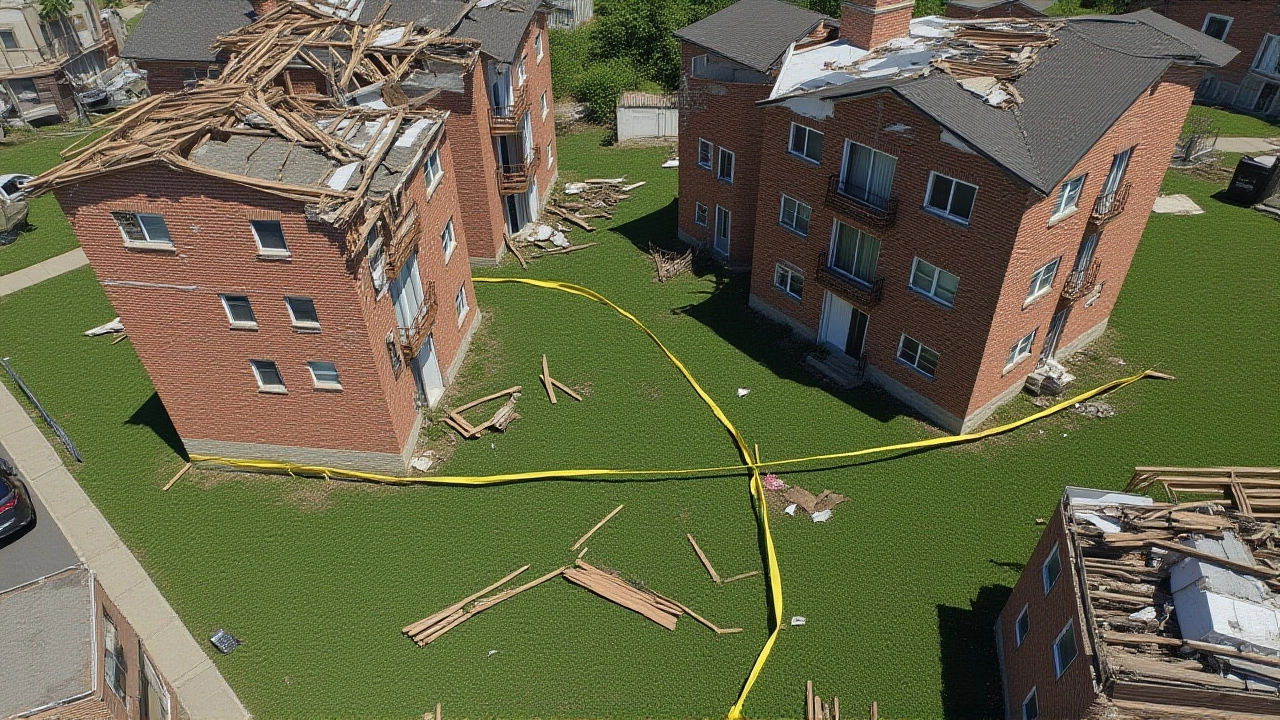
Once they find a damaged structure, the team assigns a damage indicator. There are exactly 28 of these in the official playbook. We're talking everything from well-engineered commercial buildings to single-family homes, trees, and even vehicles. Each indicator has a known resistance to wind. A sturdy brick house takes more force to destroy than a mobile home, obviously.
After picking the indicator, they assign a degree of damage. Did the roof peel off? Did the walls collapse? Was the foundation shifted? Each degree corresponds to an expected wind speed, plus lower and upper bounds. This isn't guesswork; it's physics applied to debris fields. This calculation feeds directly into the Enhanced Fujita (EF) scale rating. An EF-3 tornado isn't just "bad"; it means sustained winds between 137 and 166 mph caused specific types of structural failure.
The twist is that microbursts—intense downdrafts from thunderstorms—can cause similar levels of destruction. But the pattern gives them away. Microburst damage often looks laid out flat, with trees knocked over in roughly the same direction. Tornado damage, however, shows convergent or rotational patterns. Debris swirls. Trees snap toward each other. As the Binghamton, New York office notes, "the pattern of damage determines if it was a tornado."
Digital Tools Mapping the Aftermath
Gone are the days when this data lived only in field notebooks. Today, it flows into the Damage Assessment Toolkit (DAT), a GIS-based platform hosted on ArcGIS. Think of it as the central nervous system for post-storm analysis.
The DAT allows surveyors to collect, store, and visualize damage points in real-time. When a surveyor marks a location on their device, that point appears on a shared map. Emergency managers, researchers, and other agencies can see the developing picture of the storm's path. NASA Earthdata even characterizes this dataset as pivotal for analyzing tornado tracks and related impacts.
You don't need to be a government employee to peek at this data, either. The web-based Damage Assessment Toolkit Viewer lets anyone with a modern browser explore mapped storm damage. You can filter by date, select a specific Weather Forecast Office, and zoom in on individual damage points.
For example, if you look at data from April 2016 in Missouri, you can click on a pencil icon to reveal the EF rating, estimated wind speed, and high-resolution photos taken by the survey team. Want to take the data offline? Use the extract tool to draw a polygon around an area, export the results as a KML file, and drop it into Google Earth. Suddenly, you have a 3D view of where the tornado touched down and how far it traveled.
From Field Notes to Historical Record
Once the immediate danger passes and the surveys are complete, the data moves to its permanent home: the Storm Events Database. Maintained by the National Centers for Environmental Information (NCEI), this repository is the official record of severe weather in the United States.
This database covers events from January 1950 to February 2026. It’s not just about tornadoes, though. It includes derechos, hailstorms, flash floods, and even rare phenomena like snow flurries in South Florida. The criteria are strict: the event must cause loss of life, injuries, significant property damage, or disruption to commerce.
Crucially, the NCEI hasn't changed any historical data values during recent reformatting efforts. If a surveyor recorded 10 injuries and $2.3 million in damage in 1985, those numbers remain untouched. This consistency allows researchers to track long-term trends in severe weather frequency and intensity without worrying about shifting baselines.
Local offices play a huge role here. For instance, the Indianapolis Weather Forecast Office recently scheduled weekend surveys for Monroe County following a tornado outbreak. These local teams are the eyes on the ground, ensuring that every confirmed event gets logged accurately before being uploaded to the national database.
Why This Matters to You
So why should you care about damage indicators and GIS toolkits? Because accuracy saves lives and money. Better data leads to better warnings. If we understand how tornadoes behave in specific regions, forecasters can issue more precise alerts.
Plus, if you're ever affected by severe weather, your claim might depend on this data. Insurance adjusters often reference NWS reports to verify the severity of an event. Knowing that a specific street experienced EF-2 winds rather than EF-4 winds can significantly impact repair costs and policy coverage.
The next time you hear about a confirmed tornado outbreak, remember there's a team of scientists out there measuring tree stumps and roof shingles, turning chaos into clear, actionable data.
Frequently Asked Questions
How does the National Weather Service distinguish between tornado and straight-line wind damage?
Survey teams look at the pattern of damage rather than just the total amount. Tornado damage typically shows rotational or convergent patterns, with debris swirling and trees snapping toward each other. Straight-line winds from microbursts usually knock objects down in a uniform direction, creating a "laid out" appearance. This distinction is critical for accurate classification and rating.
What is the Damage Assessment Toolkit used for?
The Damage Assessment Toolkit (DAT) is a GIS-based platform that allows NWS surveyors to collect, store, and visualize post-storm damage data in real-time. It maps damage points, estimates wind speeds, and creates tornado tracks. The public can access a viewer version to explore historical storm data, including photos and EF ratings, for research or personal interest.
Where can I find official records of past tornadoes and storms?
Official records are stored in the Storm Events Database maintained by the National Centers for Environmental Information (NCEI). This database contains data from January 1950 to the present, documenting events that caused fatalities, injuries, or significant damage. You can search by date, location, or event type to retrieve detailed narratives and statistics.
How are Enhanced Fujita (EF) ratings determined?
EF ratings are based on 28 specific damage indicators, such as types of buildings or trees. Surveyors assess the degree of damage to these indicators and correlate it with estimated wind speeds. For example, if a well-constructed house loses its roof, it corresponds to a specific wind speed range. The highest calculated wind speed along the path determines the final EF rating for the tornado.